AIOps Statistics 2026: Every Data Point on Adoption, Cost and ROI
Conxiea
24 September 2026
→ See How Conxiea's AI InfraOps Platform Applies This Data in Practice
Every statistic on this page is sourced, dated, and linked to where it came from, Gartner, Enterprise Management Associates (EMA), ITIC, Uptime Institute, Splunk and Cisco, and Microsoft and Omdia. Nothing here is a vendor benchmark slide dressed up as independent research.
This is a reference page, not an article to read start to finish. Use the section headings to find what you need. If you're citing a figure from here in your own writing, a link back to this page is appreciated, that's what it's built for.
For the practical guides these statistics support, see our posts on what AIOps actually is, AIOps benefits and use cases, and AIOps ROI.

The Ten Numbers Worth Knowing First
- 31% of IT professionals say their network operations strategy is completely successful, down from 42% two years ago (EMA, 2026)
- 30% of enterprises will automate more than half their network activities by 2026, up from under 10% in 2023 (Gartner, 2024)
- 64% of enterprise networking teams still run on internally developed scripts (EMA)
- 61% of those teams spend six or more hours a week maintaining them (EMA)
- 52% of organisations find it difficult to hire skilled network technology experts, up from 26% in 2022 (EMA)
- 73% of IT professionals are likely to replace a network observability or monitoring tool within two years (EMA)
- $15,000 is the average cost of one minute of downtime (Splunk and Cisco, 2026)
- $600 billion a year in combined downtime losses across the Global 2000, up 50% in two years (Splunk and Cisco)
- 46% of security alerts turn out to be false positives (Microsoft and Omdia, State of the SOC 2026)
- 40% of organisations have suffered a major outage caused by human error in the past three years (Uptime Institute)
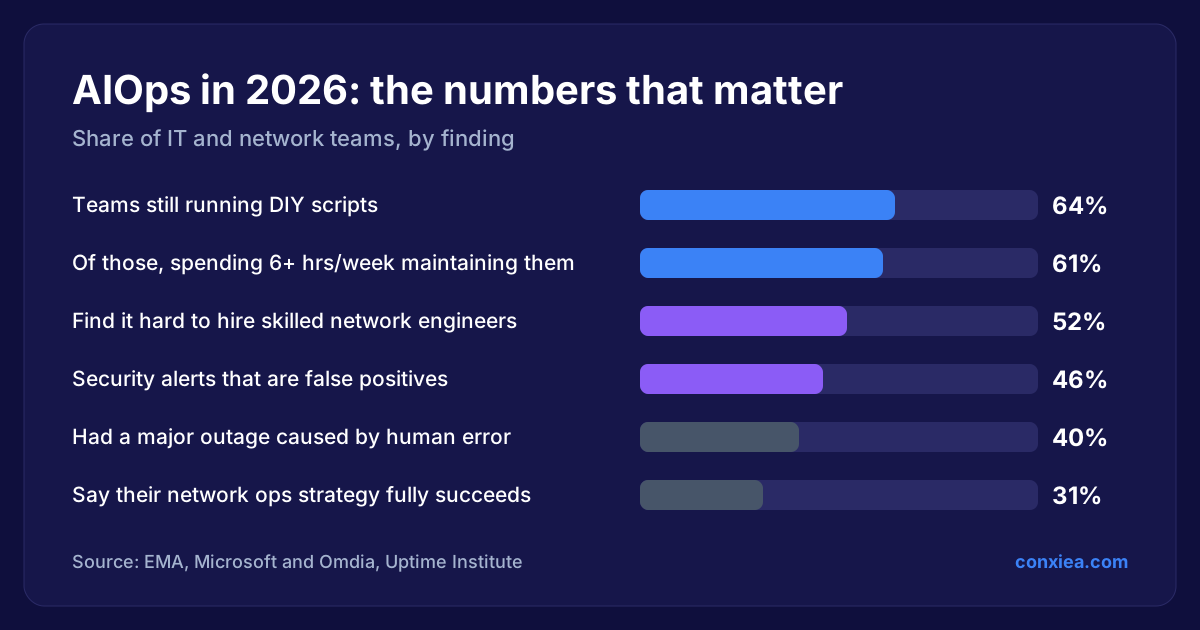 Bar chart of AIOps statistics: 64% run DIY scripts, 61% spend 6+ hours a week maintaining them, 52% struggle to hire, 46% of alerts are false positives, 40% had a human-error outage, 31% say their strategy fully succeeds
Market Size and Growth
- The AIOps platform market is estimated at roughly $14 billion to $20 billion in 2026, depending on scope and methodology, with independent analyst forecasts ranging from 15% to 30% compound annual growth. Mordor Intelligence
- The broader network automation market carries similarly wide estimates across research firms, from roughly $9.6 billion to $37.8 billion in 2026 depending on definition and scope, growing at a double-digit compound annual rate through the early 2030s across most estimates.
- Over 80% of large enterprises have deployed some level of network automation, compared with under 50% of small and mid-sized firms, a persistent maturity gap by organisation size. If you're on the smaller side of that gap, see network automation tools for small businesses.
- For the bigger picture, PwC projects AI as a whole will add $15.7 trillion to the global economy by 2030. We break that down in AI's $15.7 trillion economic impact.
Enterprise Adoption
- 30% of enterprises will automate more than half of their network activities by 2026, up from under 10% in mid-2023. Gartner press release
- "Infrastructure and operations leaders are increasingly looking to AI-based analytics and augmented decision making, including intelligent automation, to improve operational resilience." Chris Saunderson, Sr Director Analyst, Gartner
- 31% of IT professionals surveyed describe their organisation's network operations strategy as completely successful, down from 42% two years earlier, despite rising automation investment. EMA, Network Management Megatrends 2026 (352 IT professionals surveyed, North America and Europe)
- 73% of respondents are likely, or somewhat likely, to replace a network observability or monitoring tool within the next two years. EMA
- Difficulty hiring skilled network technology experts has risen from 26% of organisations in 2022, to 41% in 2024, to 52% today. EMA
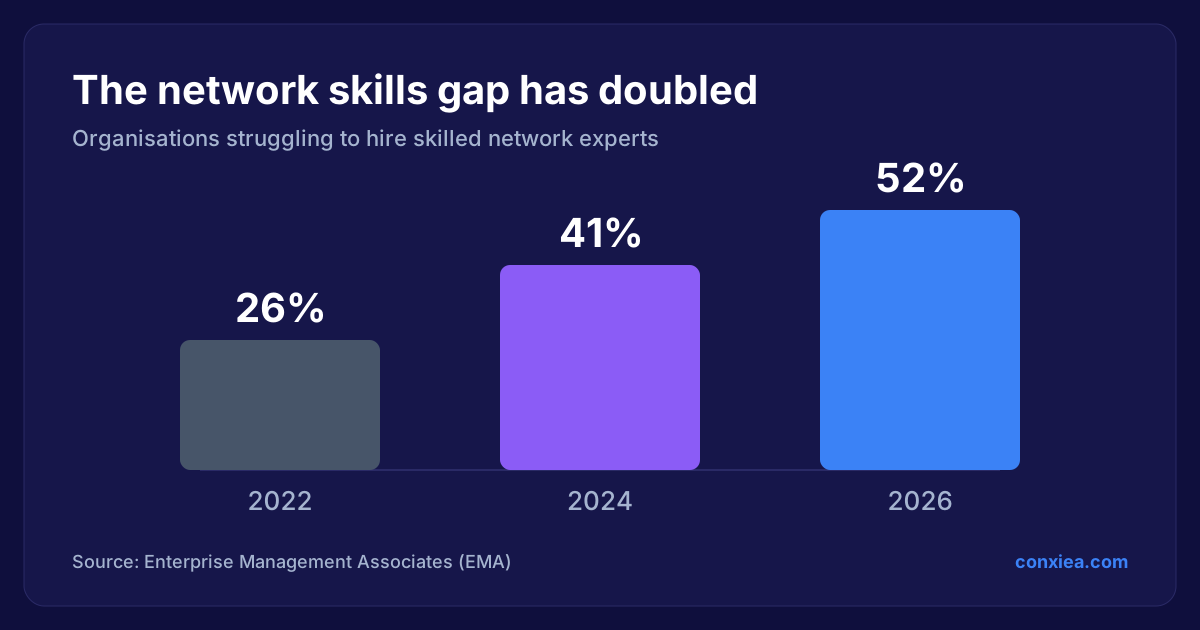 Column chart: organisations struggling to hire skilled network experts rose from 26% in 2022 to 41% in 2024 and 52% in 2026
- Operational efficiency is cited as the primary driver of network automation investment by roughly a third of adopting organisations.
The Real Cost of DIY Automation
- 64% of enterprise networking teams use internally developed software or scripts for network automation. EMA, From Scripts to Platforms
- 61% of those teams spend six or more hours a week debugging and maintaining them, per engineer. EMA
- "Most vendors can fulfill 80% of network automation use cases with commercial tools, but there always remains that 20% that only a DIY approach can address." Shamus McGillicuddy, VP of Research, EMA
If your team recognises itself in those numbers, read signs your network team has outgrown Ansible and why network automation projects fail.
Alert Fatigue and Noise
- Mature AIOps deployments commonly report cutting raw alert volume by more than 90% through correlation, deduplication, and noise reduction.
- 46% of all security alerts prove to be false positives. Microsoft and Omdia, State of the SOC 2026
- 76% of organisations cite alert fatigue as a primary SOC concern. Cybersecurity Insiders, 2025
- Almost 90% of security operations centres report being overwhelmed by alert backlogs and false positives.
- Average security analyst tenure in role is commonly cited at three to five years, with alert fatigue and burnout among the most consistently reported causes of turnover.
What to do about it: how to reduce alert fatigue in IT operations.
The Cost of Network and IT Downtime

- The average cost of downtime is roughly $15,000 per minute. Splunk and Cisco, Hidden Costs of Downtime 2026
- Unplanned outages cost the Global 2000 a combined $600 billion a year, up 50% in two years. Splunk and Cisco
- 93% of midsize and large enterprises report that one hour of downtime costs more than $300,000, and 41% report hourly costs of $1 million or more. ITIC, Hourly Cost of Downtime Survey
- 40% of organisations have suffered a major outage caused by human error in the past three years. Uptime Institute, Annual Outage Analysis 2025
- 23% of impactful outages in 2024 were attributed specifically to IT and networking issues, a category that grew year over year. Uptime Institute
- 85% of human-error-related outages stem from staff not following procedure, or from the procedures themselves being flawed. Uptime Institute
- Power remains the single leading cause of impactful outages across data centre and network infrastructure. Uptime Institute
For the practical side, see how to reduce network downtime and how to automate network change management, since procedure failures are the main cause of human-error outages.
Security Operations and AIOps
- 46% of security alerts are false positives. Microsoft and Omdia, State of the SOC 2026
- 76% of organisations cite alert fatigue as a primary concern for their security operations centre. Cybersecurity Insiders, 2025
- Almost 90% of SOCs report being overwhelmed by backlogs and false positives.
How AIOps tackles this in practice: AIOps use cases for security operations.
ROI and Business Impact
- Engineering time lost to DIY script maintenance alone, 6+ hours a week per engineer for the majority of teams still running DIY automation, is frequently the single largest, and most invisible, line item in a manual operations cost comparison. EMA
- The most credible AIOps business cases compare platform cost against the combined cost of engineer hours, downtime, and turnover, not licence fee against nothing. See our full ROI walkthrough for a worked example.
Sources
- Gartner: 30% of Enterprises Will Automate More Than Half of Their Network Activities by 2026
- EMA: Network Management Megatrends 2026
- EMA: From Scripts to Platforms, DIY Network Automation Research
- ITIC: Hourly Cost of Downtime Survey
- Uptime Institute: Annual Outage Analysis 2025
- Splunk and Cisco: The Hidden Costs of Downtime
- Mordor Intelligence: AIOps Market Report
Frequently Asked Questions
How often is this page updated?
Whenever a cited report is refreshed with a new edition, most of these are annual surveys, or a figure is superseded by newer research. The publication date at the top of this page reflects the last review.
Can I cite these statistics in my own article?
Yes. Each figure links to its original source, and a link back to this page when you use one is appreciated, but the underlying data belongs to the organisations that produced it, not to us. Please verify figures against the original source for anything used in a formal or regulated context.
Why do the market size estimates vary so much between sources?
Different analyst firms scope "AIOps" and "network automation" differently, some include adjacent categories like broader IT operations management or observability tooling, others don't. We've presented the range rather than picking one figure, so you can see the spread rather than a false sense of precision.
Want the reasoning behind these numbers applied to your own environment?
At Conxiea, we help teams turn statistics like these into an actual business case and a working AI InfraOps deployment.
No obligations. We'll help you work out what these numbers mean for your specific environment, not just quote them back at you.
Related Reading
- AIOps Benefits and Use Cases: Real Results for IT and Network Teams
- AIOps ROI: How to Build the Business Case and Calculate Payback
- What Is AIOps? The Complete Beginner's Guide
- AIOps for Security Operations: Anomaly Detection and Threat Correlation Use Cases
- How to Reduce Network Downtime: Causes, Costs and a Practical Framework
- Network Automation Platforms and Tools: The Complete 2026 Guide


